3. Gráficos básicos: matplotlib & seaborn#
import matplotlib as mpl
mpl.get_backend()
'module://matplotlib_inline.backend_inline'
import matplotlib.pyplot as plt
plt.rcParams.update({'figure.max_open_warning': 0})
#plt.plot?
Dado que el estilo predeterminado es la línea ‘-’, no se mostrará nada si solo pasamos en un punto \((3,2)\)
plt.plot(3, 2)
[<matplotlib.lines.Line2D at 0x7fce03dc3280>]
Podemos pasarle ‘.’ a plt.plot para indicar que queremos el punto \((3,2)\) tal que sea puesto como un marker
plt.plot(3, 2, '.')
[<matplotlib.lines.Line2D at 0x7fce03df9ca0>]
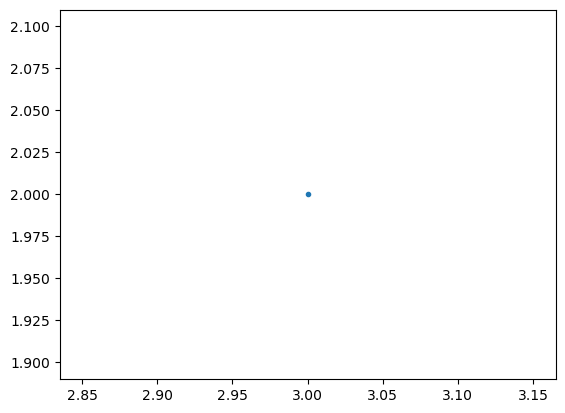
Veamos como hacer un plot usando la capa scripting.
# Primero configuremos el backend sin usar mpl.use() de la capa de scripting
from matplotlib.backends.backend_agg import FigureCanvasAgg
from matplotlib.figure import Figure

# crear una nueva figura
fig = Figure()

# asociamos "fig" con el backend
canvas = FigureCanvasAgg(fig)

# se agrega un subplot a la figura
ax = fig.add_subplot(111)

# graficamos el punto (3,2)
ax.plot(3, 2, '.')

# guardamos la figura en test.png
#canvas.print_png('test.png')
[<matplotlib.lines.Line2D at 0x7fce04a365e0>]
# creamos una nueva figura
plt.figure()

# graficamos el punto (3,2) usando el marker de circulo
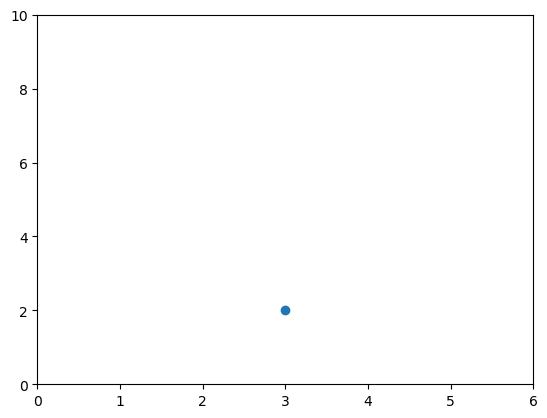
plt.plot(3, 2, 'o')

# obtenemos el eje actual
ax = plt.gca()

# Fijamos las propiedades del eje [xmin, xmax, ymin, ymax]
ax.axis([0,6,0,10])
(0.0, 6.0, 0.0, 10.0)
# creamos una nueva figura
plt.figure()

# graficamos el punto (1.5, 1.5) usando un marker de circulo
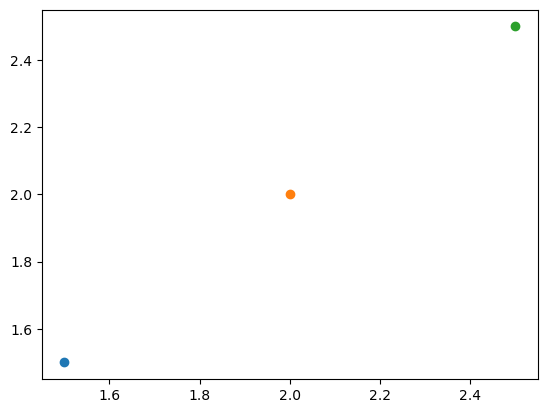
plt.plot(1.5, 1.5, 'o')
# graficamos el punto (2, 2) usando un marker de circulo
plt.plot(2, 2, 'o')
# graficamos el punto (2.5, 2.5) usando un marker de circulo
plt.plot(2.5, 2.5, 'o')
[<matplotlib.lines.Line2D at 0x7fce04be8eb0>]
# Accedemos al eje actual
ax = plt.gca()
# obtenemos todos los objetos hijo que contiene el eje
ax.get_children()
[<matplotlib.spines.Spine at 0x7fce04c2f3d0>,
 <matplotlib.spines.Spine at 0x7fce04c2f4c0>,
 <matplotlib.spines.Spine at 0x7fce04c2f5b0>,
 <matplotlib.spines.Spine at 0x7fce04c2f6a0>,
 <matplotlib.axis.XAxis at 0x7fce04c2f400>,
 <matplotlib.axis.YAxis at 0x7fce04c2fc10>,
 Text(0.5, 1.0, ''),
 Text(0.0, 1.0, ''),
 Text(1.0, 1.0, ''),
 <matplotlib.patches.Rectangle at 0x7fce04c3de80>]
3.1. Scatterplots#
import numpy as np

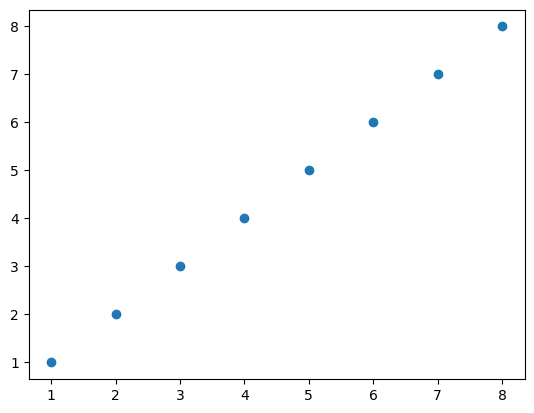
x = np.array([1,2,3,4,5,6,7,8])
y = x

plt.figure()
plt.scatter(x, y) # similar a plt.plot(x, y, '.'), pero los objetos hijos en "axes" no son Line2D
<matplotlib.collections.PathCollection at 0x7fce04dc0880>
import numpy as np

x = np.array([1,2,3,4,5,6,7,8])
y = x

# creamos una lista de colores para cada punto que tenemos
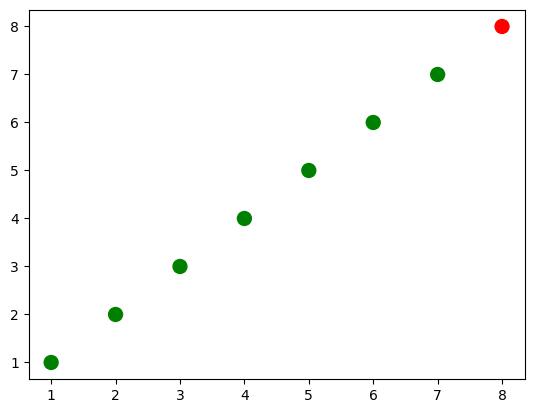
# ['green', 'green', 'green', 'green', 'green', 'green', 'green', 'red']
colors = ['green']*(len(x)-1)
colors.append('red')

plt.figure()

# graficamos el punto con tamaño 100 y los colores elegidos
plt.scatter(x, y, s=100, c=colors)
<matplotlib.collections.PathCollection at 0x7fce05066280>
# convertimos las dos listas en una lista de tuplas en parejas
zip_generator = zip([1,2,3,4,5], [6,7,8,9,10])

print(list(zip_generator))
# lo de arriba imprime:
# [(1, 6), (2, 7), (3, 8), (4, 9), (5, 10)]

zip_generator = zip([1,2,3,4,5], [6,7,8,9,10])
# La estrella * "desempaca" una colección en argumentos posicionales
print(*zip_generator)
# lo de arriba imprime:
# (1, 6) (2, 7) (3, 8) (4, 9) (5, 10)
[(1, 6), (2, 7), (3, 8), (4, 9), (5, 10)]
(1, 6) (2, 7) (3, 8) (4, 9) (5, 10)
# use zip para convertir 5 tuplas con 2 elementos cada una en 2 tuplas con 5 elementos cada una
print(list(zip((1, 6), (2, 7), (3, 8), (4, 9), (5, 10))))
# lo de arriba imprime:
# [(1, 2, 3, 4, 5), (6, 7, 8, 9, 10)]


zip_generator = zip([1,2,3,4,5], [6,7,8,9,10])
# volvamos los datos a 2 listas
x, y = zip(*zip_generator) # Lo siguiente es equivalente zip((1, 6), (2, 7), (3, 8), (4, 9), (5, 10))
print(x)
print(y)
# lo de arriba imprime:
# (1, 2, 3, 4, 5)
# (6, 7, 8, 9, 10)
[(1, 2, 3, 4, 5), (6, 7, 8, 9, 10)]
(1, 2, 3, 4, 5)
(6, 7, 8, 9, 10)
plt.figure()
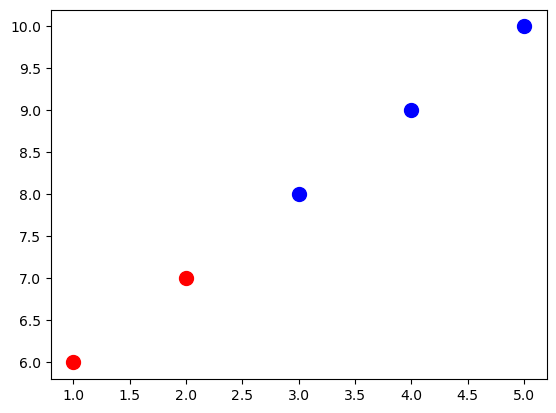
# graficar una serie de datos 'Estudiantes altos' en rojo usando los dos primeros elementos de x e y
plt.scatter(x[:2], y[:2], s=100, c='red', label='Estudiantes altos')
# graficamos una segunda serie de datos 'Estudiantes bajos' en azul usando los últimos tres elementos de x e y
plt.scatter(x[2:], y[2:], s=100, c='blue', label='Estudiantes bajos')
<matplotlib.collections.PathCollection at 0x7fce048fd790>
# agregamos una etiqueta en el eje x
plt.xlabel('Número de veces que el niño patea una pelota')
# agregamos una etiqueta en el eje y
plt.ylabel('La nota del estudiante')
# add a title
plt.title('Relación entre patear la pelota y notas')
Text(0.5, 1.0, 'Relación entre patear la pelota y notas')
# agregar una leyenda (usa las etiquetas de plt.scatter)
plt.legend()
No artists with labels found to put in legend. Note that artists whose label start with an underscore are ignored when legend() is called with no argument.
<matplotlib.legend.Legend at 0x7fce0534c490>
# agregue la leyenda a loc = 4 (la esquina inferior derecha), también elimina el marco y agrega un título
plt.legend(loc=4, frameon=False, title='Legenda')
No artists with labels found to put in legend. Note that artists whose label start with an underscore are ignored when legend() is called with no argument.
<matplotlib.legend.Legend at 0x7fce055df670>
# obtener hijos de los ejes actuales (la leyenda es el penúltimo elemento de esta lista)
plt.gca().get_children()
[<matplotlib.spines.Spine at 0x7fce0573a910>,
 <matplotlib.spines.Spine at 0x7fce0573aa00>,
 <matplotlib.spines.Spine at 0x7fce0573aaf0>,
 <matplotlib.spines.Spine at 0x7fce0573abe0>,
 <matplotlib.axis.XAxis at 0x7fce0573a940>,
 <matplotlib.axis.YAxis at 0x7fce05744190>,
 Text(0.5, 1.0, ''),
 Text(0.0, 1.0, ''),
 Text(1.0, 1.0, ''),
 <matplotlib.patches.Rectangle at 0x7fce05755160>]

3.2. Gráficos de linea#
import numpy as np

linear_data = np.array([1,2,3,4,5,6,7,8])
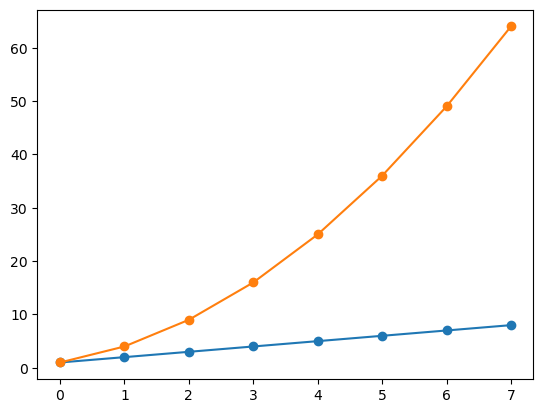
exponential_data = linear_data**2

plt.figure()
# graficar los datos lineales y los datos exponenciales
plt.plot(linear_data, '-o', exponential_data, '-o')
[<matplotlib.lines.Line2D at 0x7fce059e22b0>,
 <matplotlib.lines.Line2D at 0x7fce059e2370>]
# graficar otra serie con una línea roja discontinua
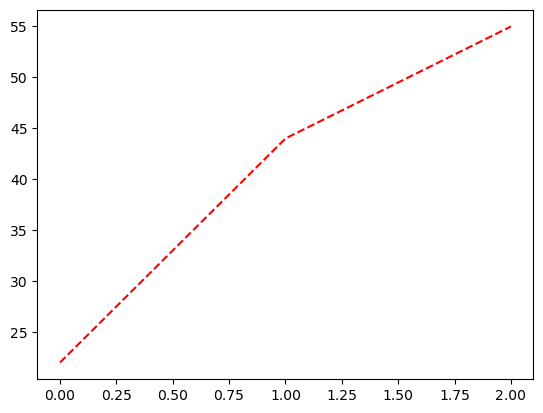
plt.plot([22,44,55], '--r')
[<matplotlib.lines.Line2D at 0x7fce05a843d0>]
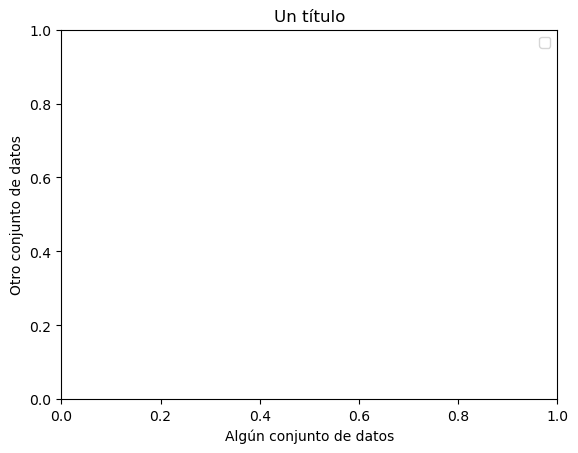
plt.xlabel('Algún conjunto de datos')
plt.ylabel('Otro conjunto de datos')
plt.title('Un título')
# agregue una leyenda con entradas de leyenda (porque no teníamos etiquetas cuando graficamos la serie de datos)
plt.legend(['Línea base', 'Compentencia', 'Nosotros'])
<matplotlib.legend.Legend at 0x7fce05aa4dc0>
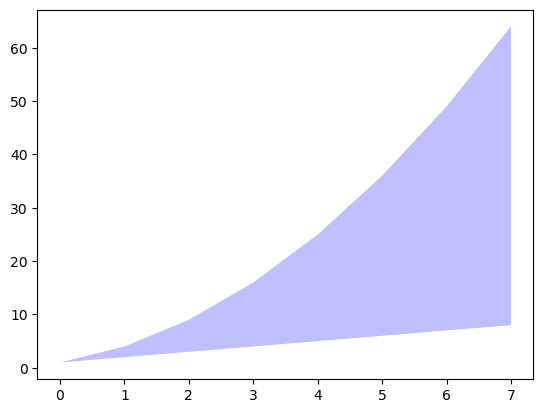
# llenar el área entre los datos lineales y los datos exponenciales
plt.gca().fill_between(range(len(linear_data)),
                       linear_data, exponential_data,
                       facecolor='blue',
                       alpha=0.25)
<matplotlib.collections.PolyCollection at 0x7fce05e944c0>
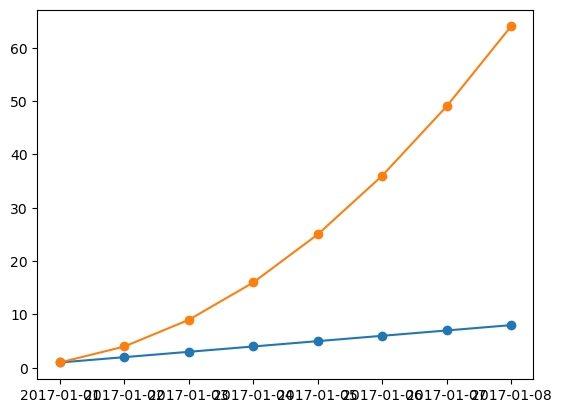
¡Intentemos trabajar con fechas!
plt.figure()

observation_dates = np.arange('2017-01-01', '2017-01-09', dtype='datetime64[D]')

plt.plot(observation_dates, linear_data, '-o',  observation_dates, exponential_data, '-o')
[<matplotlib.lines.Line2D at 0x7fce05ee9760>,
 <matplotlib.lines.Line2D at 0x7fce05f36a60>]
Intentemos usar pandas
import pandas as pd
plt.figure()
observation_dates = np.arange('2017-01-01', '2017-01-09', dtype='datetime64[D]')
observation_dates = list(map(pd.to_datetime, observation_dates)) #convertir el map en una lista
plt.plot(observation_dates, linear_data, '-o',  observation_dates, exponential_data, '-o')
[<matplotlib.lines.Line2D at 0x7fce06fe2940>,
 <matplotlib.lines.Line2D at 0x7fce0700edc0>]

x = plt.gca().xaxis

# rotar las etiquetas del eje x
for item in x.get_ticklabels():
    item.set_rotation(45)
# ajustar el subplot para que el texto no se salga de la imagen
plt.subplots_adjust(bottom=0.25)
<Figure size 640x480 with 0 Axes>
ax = plt.gca()
ax.set_xlabel('Fecha')
ax.set_ylabel('Unidades')
ax.set_title('Rendimiento Exponencial vs. Lineal')
Text(0.5, 1.0, 'Rendimiento Exponencial vs. Lineal')
# you can add mathematical expressions in any text element
ax.set_title("Rendimiento Exponential ($x^2$) vs. Linear ($x$)")
Text(0.5, 1.0, 'Rendimiento Exponential ($x^2$) vs. Linear ($x$)')
3.3. Gráficos de barras#
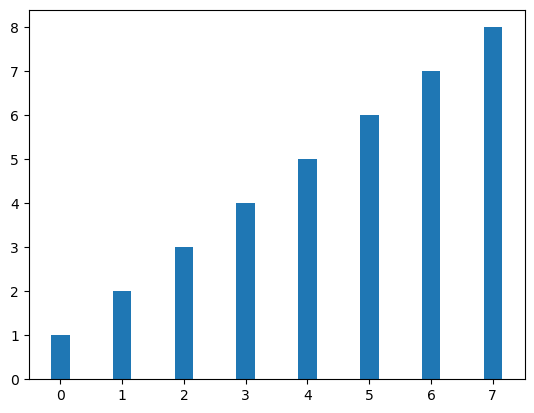
plt.figure()
xvals = range(len(linear_data))
plt.bar(xvals, linear_data, width = 0.3)
<BarContainer object of 8 artists>
new_xvals = []

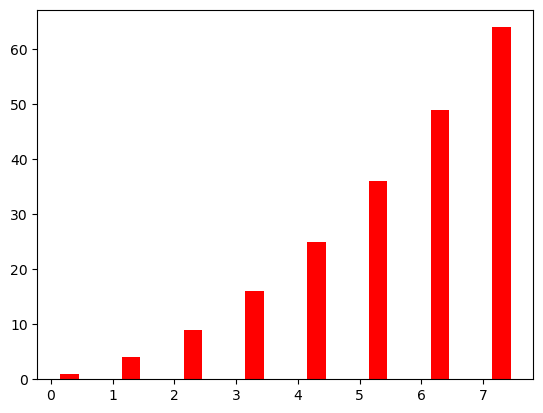
# graficar otro conjunto de barras, ajustando los nuevos "xvals" para compensar el primer conjunto de barras graficados
for item in xvals:
    new_xvals.append(item+0.3)

plt.bar(new_xvals, exponential_data, width = 0.3 ,color='red')
<BarContainer object of 8 artists>
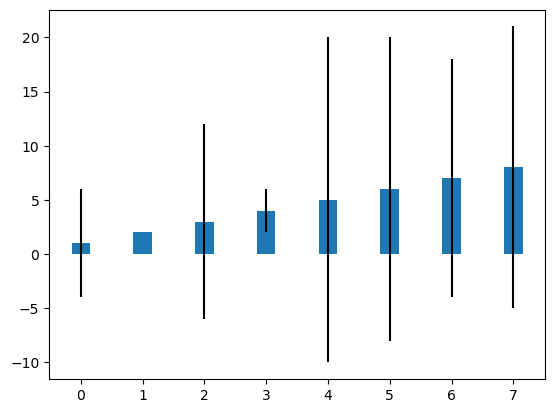
from random import randint
linear_err = [randint(0,15) for x in range(len(linear_data))]

# Esto graficará un nuevo conjunto de barras con barras de error utilizando la lista de valores de error aleatorios.
plt.bar(xvals, linear_data, width = 0.3, yerr=linear_err)
<BarContainer object of 8 artists>
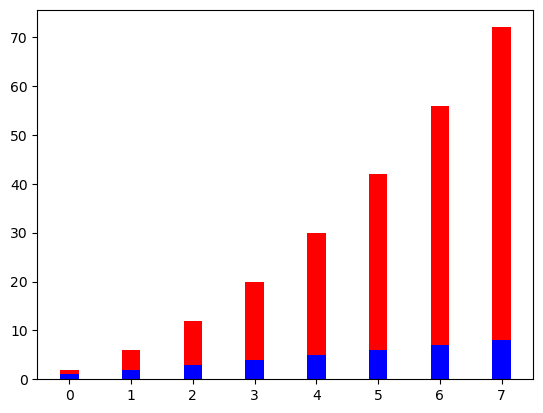
# También son posibles gráficos de barras apiladas
plt.figure()
xvals = range(len(linear_data))
plt.bar(xvals, linear_data, width = 0.3, color='b')
plt.bar(xvals, exponential_data, width = 0.3, bottom=linear_data, color='r')
<BarContainer object of 8 artists>
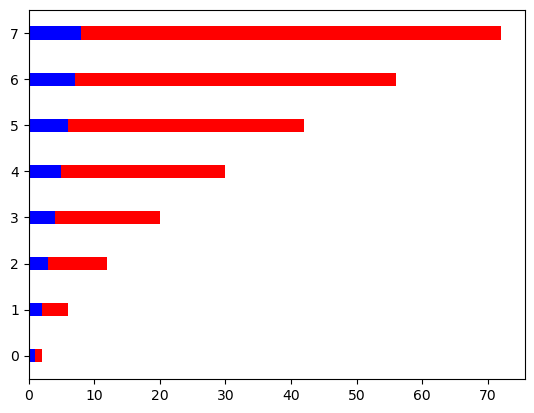
# o usar "barh" para gráficos de barras horizontales
plt.figure()
xvals = range(len(linear_data))
plt.barh(xvals, linear_data, height = 0.3, color='b')
plt.barh(xvals, exponential_data, height = 0.3, left=linear_data, color='r')
<BarContainer object of 8 artists>
3.4. Subplots#
import matplotlib.pyplot as plt
import numpy as np

#plt.subplot?
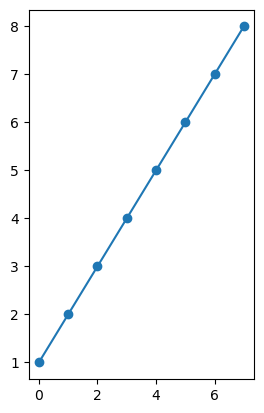
plt.figure()
# el subplot con 1 fila, 2 columnas y el eje actual es el primer eje del subplot
plt.subplot(1, 2, 1)

linear_data = np.array([1,2,3,4,5,6,7,8])

plt.plot(linear_data, '-o')
[<matplotlib.lines.Line2D at 0x7fce07bab430>]
exponential_data = linear_data**2

# el subplot con 1 fila, 2 columnas, y el eje actual es el segundo eje del subplot
plt.subplot(1, 2, 2)
plt.plot(exponential_data, '-o')
[<matplotlib.lines.Line2D at 0x7fce07d1b250>]
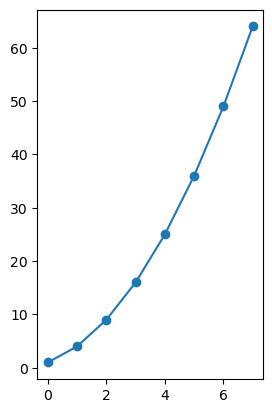
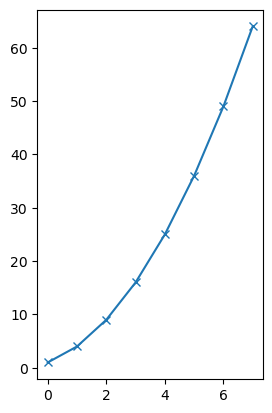
# graficar datos exponenciales en el primer eje
plt.subplot(1, 2, 1)
plt.plot(exponential_data, '-x')
[<matplotlib.lines.Line2D at 0x7fce07dcf8e0>]
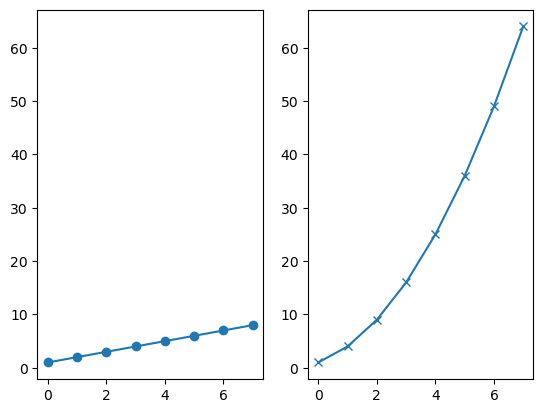
plt.figure()
ax1 = plt.subplot(1, 2, 1)
plt.plot(linear_data, '-o')
# pasamos sharey = ax1 para asegurarse de que los dos subplots compartan el mismo eje y
ax2 = plt.subplot(1, 2, 2, sharey=ax1)
plt.plot(exponential_data, '-x')
[<matplotlib.lines.Line2D at 0x7fce07f35fa0>]
plt.figure()
# el lado derecho es una sintaxis abreviada equivalente
plt.subplot(1,2,1) == plt.subplot(121)
True
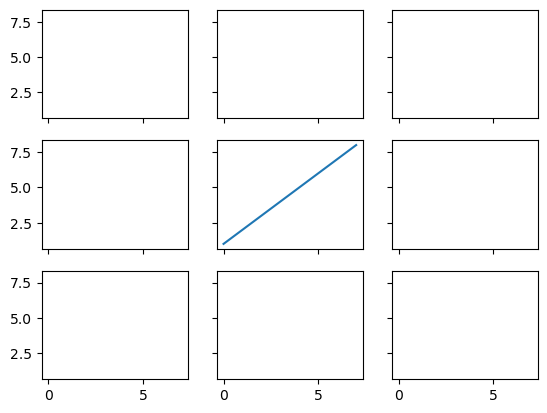
# creamos un grid 3x3 de subplots
fig, ((ax1,ax2,ax3), (ax4,ax5,ax6), (ax7,ax8,ax9)) = plt.subplots(3, 3, sharex=True, sharey=True)
# graficamos linear_data en el quinto eje del subplot
ax5.plot(linear_data, '-')
[<matplotlib.lines.Line2D at 0x7fce07b6fac0>]
3.5. Histogramas#
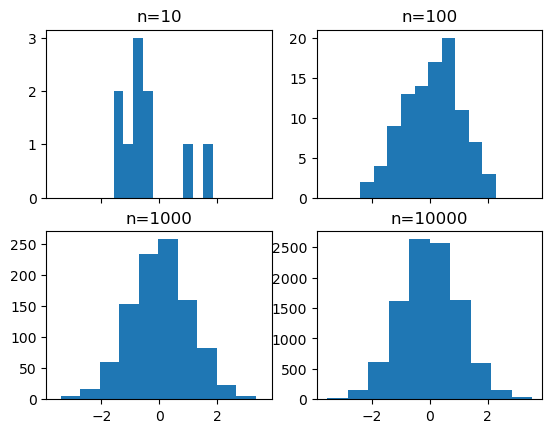
# creamos un grid 2x2 de subplots
fig, ((ax1, ax2), (ax3, ax4)) = plt.subplots(2, 2, sharex=True)
axs = [ax1,ax2,ax3,ax4]
import random
random.seed(30)
# obtenemos muestras de n = 10, 100, 1000, y 10000 de uns distribución normal y graficamos los histogramas
for n in range(0,len(axs)):
    sample_size = 10**(n+1)
    sample = np.random.normal(loc=0.0, scale=1.0, size=sample_size)
    axs[n].hist(sample)
    axs[n].set_title('n={}'.format(sample_size))
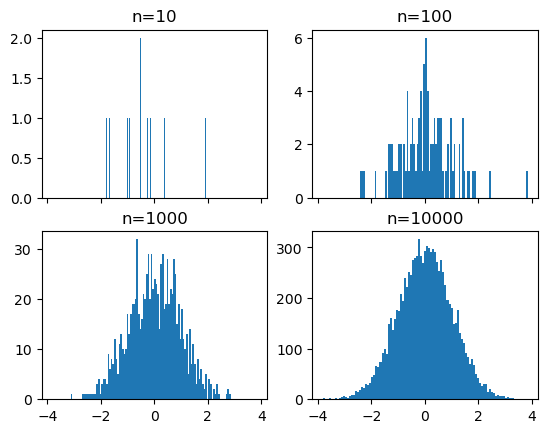
# repetimos con el numero de bins en 100
fig, ((ax1, ax2), (ax3, ax4)) = plt.subplots(2, 2, sharex=True)
axs = [ax1,ax2,ax3,ax4]

for n in range(0,len(axs)):
    sample_size = 10**(n+1)
    sample = np.random.normal(loc=0.0, scale=1.0, size=sample_size)
    axs[n].hist(sample, bins=100)
    axs[n].set_title('n={}'.format(sample_size))
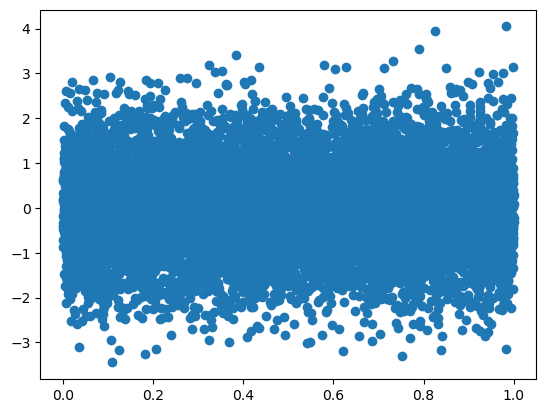
plt.figure()
Y = np.random.normal(loc=0.0, scale=1.0, size=10000)
X = np.random.random(size=10000)
plt.scatter(X,Y)
<matplotlib.collections.PathCollection at 0x7fce0a0b5fd0>
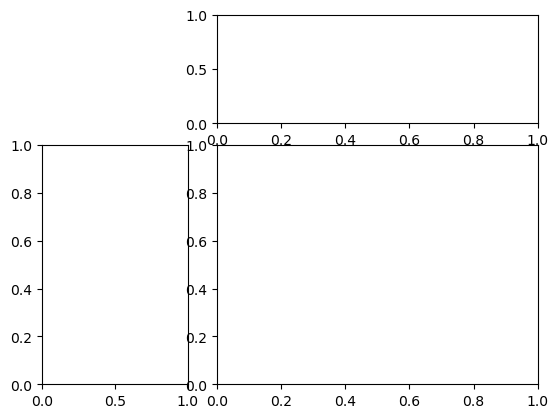
# usamos gridspec para dividir la figura en subplots
import matplotlib.gridspec as gridspec

plt.figure()
gspec = gridspec.GridSpec(3, 3)

top_histogram = plt.subplot(gspec[0, 1:])
side_histogram = plt.subplot(gspec[1:, 0])
lower_right = plt.subplot(gspec[1:, 1:])
Y = np.random.normal(loc=0.0, scale=1.0, size=10000)
X = np.random.random(size=10000)
lower_right.scatter(X, Y)
top_histogram.hist(X, bins=100)
s = side_histogram.hist(Y, bins=100, orientation='horizontal')
# limpieamos los histogramas  y graficamos los plots normados
top_histogram.clear()
top_histogram.hist(X, bins=100, density=True)
side_histogram.clear()
side_histogram.hist(Y, bins=100, orientation='horizontal', density=True)
# flip the side histogram's x axis
side_histogram.invert_xaxis()
3.6. Boxplots#
import pandas as pd
normal_sample = np.random.normal(loc=0.0, scale=1.0, size=10000)
random_sample = np.random.random(size=10000)
gamma_sample = np.random.gamma(2, size=10000)

df = pd.DataFrame({'normal': normal_sample,
                   'random': random_sample,
                   'gamma': gamma_sample})
df.describe()
| normal | random | gamma | |
|---|---|---|---|
| count | 10000.000000 | 10000.000000 | 10000.000000 |
| mean | 0.022058 | 0.496203 | 2.001121 |
| std | 1.006828 | 0.289074 | 1.421475 |
| min | -3.705981 | 0.000023 | 0.007623 |
| 25% | -0.666002 | 0.246149 | 0.955794 |
| 50% | 0.015400 | 0.494168 | 1.692489 |
| 75% | 0.708854 | 0.745258 | 2.682168 |
| max | 3.691711 | 0.999688 | 13.809579 |
plt.figure()
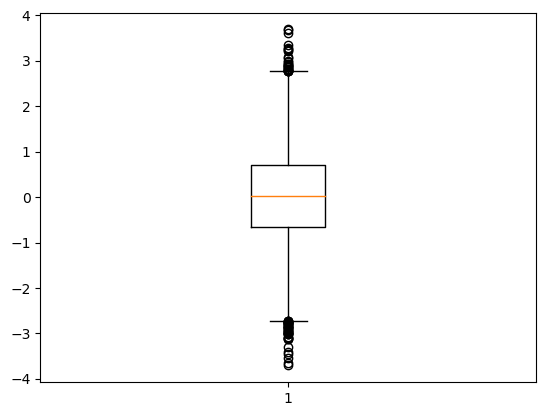
# crear un diagrama de caja de los datos normales, note el ";" al final
plt.boxplot(df['normal']);
# limpiamos la figura
plt.clf()
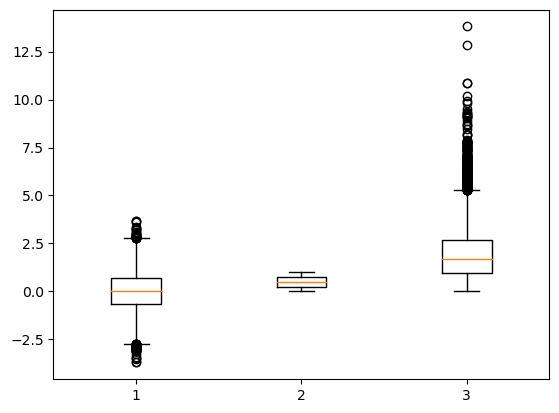
# graficamos diagramas de caja para las tres columnas de df
plt.boxplot([ df['normal'], df['random'], df['gamma'] ]);
plt.figure()
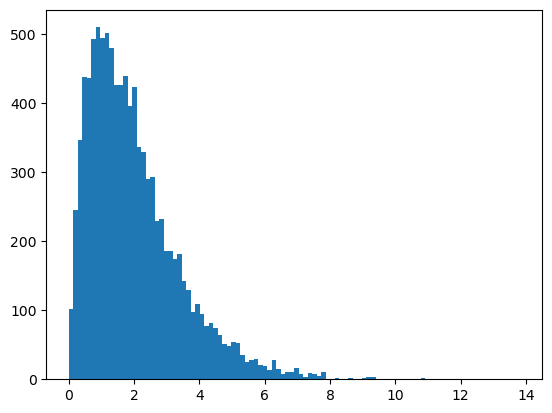
plt.hist(df['gamma'], bins=100);
import mpl_toolkits.axes_grid1.inset_locator as mpl_il

plt.figure()
plt.boxplot([ df['normal'], df['random'], df['gamma'] ])
# superponer el eje encima de otro
ax2 = mpl_il.inset_axes(plt.gca(), width='60%', height='40%', loc=2)
ax2.hist(df['gamma'], bins=100)
ax2.margins(x=0.5)
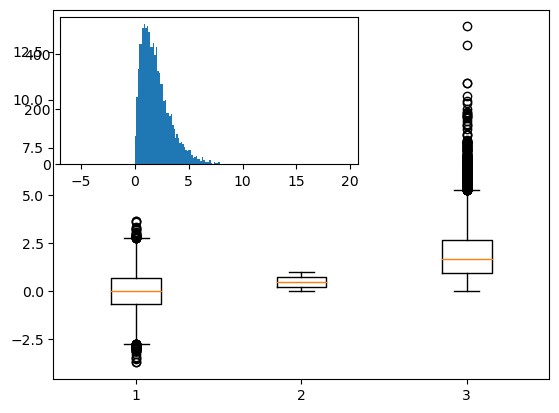
# cambiar las marcas del eje y para ax2 al lado derecho
ax2.yaxis.tick_right()
# si no se pasa el argumento `whis`, el boxplot tiene por default to mostrar 1.5*interquartile (IQR) con outliers
plt.figure()
plt.boxplot([ df['normal'], df['random'], df['gamma'] ] );

3.7. Heatmaps#
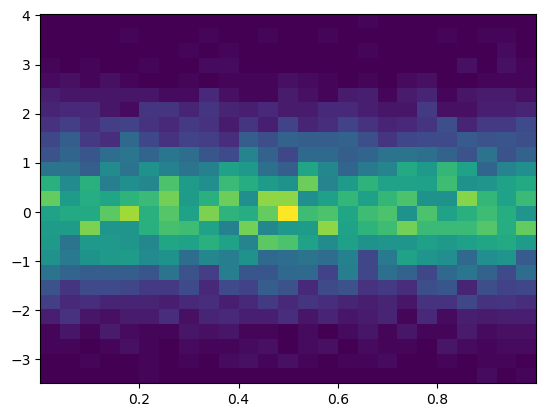
plt.figure()

Y = np.random.normal(loc=0.0, scale=1.0, size=10000)
X = np.random.random(size=10000)
plt.hist2d(X, Y, bins=25);
plt.figure()
plt.hist2d(X, Y, bins=100);
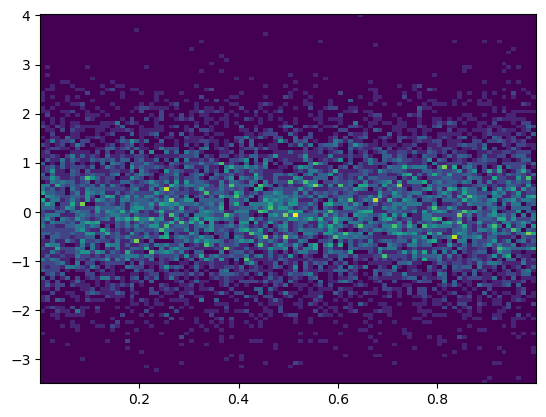
# añadimos la leyenda de colores
plt.colorbar()
---------------------------------------------------------------------------
RuntimeError                              Traceback (most recent call last)
Cell In[56], line 2
      1 # añadimos la leyenda de colores
----> 2 plt.colorbar()

File ~/opt/anaconda3/lib/python3.9/site-packages/matplotlib/pyplot.py:2133, in colorbar(mappable, cax, ax, **kwargs)
   2131     mappable = gci()
   2132     if mappable is None:
-> 2133         raise RuntimeError('No mappable was found to use for colorbar '
   2134                            'creation. First define a mappable such as '
   2135                            'an image (with imshow) or a contour set ('
   2136                            'with contourf).')
   2137 ret = gcf().colorbar(mappable, cax=cax, ax=ax, **kwargs)
   2138 return ret

RuntimeError: No mappable was found to use for colorbar creation. First define a mappable such as an image (with imshow) or a contour set (with contourf).
<Figure size 640x480 with 0 Axes>
3.8. Visualización con Pandas#
import pandas as pd
import numpy as np
import matplotlib.pyplot as plt
# consulte los estilos predefinidos proporcionados.
plt.style.available
['Solarize_Light2',
 '_classic_test_patch',
 '_mpl-gallery',
 '_mpl-gallery-nogrid',
 'bmh',
 'classic',
 'dark_background',
 'fast',
 'fivethirtyeight',
 'ggplot',
 'grayscale',
 'seaborn',
 'seaborn-bright',
 'seaborn-colorblind',
 'seaborn-dark',
 'seaborn-dark-palette',
 'seaborn-darkgrid',
 'seaborn-deep',
 'seaborn-muted',
 'seaborn-notebook',
 'seaborn-paper',
 'seaborn-pastel',
 'seaborn-poster',
 'seaborn-talk',
 'seaborn-ticks',
 'seaborn-white',
 'seaborn-whitegrid',
 'tableau-colorblind10']
# usamos el estilo 'seaborn-colorblind'
plt.style.use('seaborn-colorblind')
3.8.1. DataFrame.plot#
np.random.seed(123)

df = pd.DataFrame({'A': np.random.randn(365).cumsum(0),
                   'B': np.random.randn(365).cumsum(0) + 20,
                   'C': np.random.randn(365).cumsum(0) - 20},
                  index=pd.date_range('1/1/2017', periods=365))
df.head()
| A | B | C | |
|---|---|---|---|
| 2017-01-01 | -1.085631 | 20.059291 | -20.230904 |
| 2017-01-02 | -0.088285 | 21.803332 | -16.659325 |
| 2017-01-03 | 0.194693 | 20.835588 | -17.055481 |
| 2017-01-04 | -1.311601 | 21.255156 | -17.093802 |
| 2017-01-05 | -1.890202 | 21.462083 | -19.518638 |
Podemos seleccionar qué gráfico queremos usar pasándolo al parámetro ‘kind’.
df.plot('A','B', kind = 'scatter');
También puede elegir el tipo de figura utilizando los métodos DataFrame.plot.kind en lugar de proporcionar el argumento kind.
kind :
'line': line plot (default)'bar': vertical bar plot'barh': horizontal bar plot'hist': histogram'box': boxplot'kde': Kernel Density Estimation plot'density': same as ‘kde’'area': area plot'pie': pie plot'scatter': scatter plot'hexbin': hexbin plot
# crear un diagrama de dispersión de las columnas 'A' y 'C', cambiando el color (c) y el tamaño (s) según la columna 'B'
df.plot.scatter('A', 'C', c='B', s=df['B'], colormap='viridis');
ax = df.plot.scatter('A', 'C', c='B', s=df['B'], colormap='viridis')
ax.set_aspect('equal')
df.plot.box();
df.plot.hist(alpha=0.7);
Los gráficos de estimación de densidad con kernel son útiles para derivar una función continua suave a partir de una muestra determinada.
df.plot.kde();
3.8.2. pandas.tools.plotting#
#import os as os
#os.chdir("C:/Users/VICTOR/Documents/AnalyticsPython/Data")
iris = pd.read_csv('Data/iris.csv')
iris.head()
| SepalLength | SepalWidth | PetalLength | PetalWidth | Name | |
|---|---|---|---|---|---|
| 0 | 5.1 | 3.5 | 1.4 | 0.2 | Iris-setosa |
| 1 | 4.9 | 3.0 | 1.4 | 0.2 | Iris-setosa |
| 2 | 4.7 | 3.2 | 1.3 | 0.2 | Iris-setosa |
| 3 | 4.6 | 3.1 | 1.5 | 0.2 | Iris-setosa |
| 4 | 5.0 | 3.6 | 1.4 | 0.2 | Iris-setosa |
pd.plotting.scatter_matrix(iris);
plt.figure()
#pd.tools.plotting.parallel_coordinates(iris, 'Name');
pd.plotting.parallel_coordinates(iris, 'Name');
3.9. Seaborn#
import numpy as np
import pandas as pd
import matplotlib.pyplot as plt
import seaborn as sns
np.random.seed(1234)

v1 = pd.Series(np.random.normal(0,10,1000), name='v1')
v2 = pd.Series(2*v1 + np.random.normal(60,15,1000), name='v2')
plt.figure()
plt.hist(v1, alpha=0.7, bins=np.arange(-50,150,5), label='v1');
plt.hist(v2, alpha=0.7, bins=np.arange(-50,150,5), label='v2');
plt.legend();
# graficar la estimación de la densidad del kernel sobre un gráfico de barras apilado
plt.figure()
plt.hist([v1, v2], histtype='barstacked', density=True);
v3 = np.concatenate((v1,v2))
sns.kdeplot(v3);
v3.shape
(2000,)
plt.figure()
# podemos pasar argumentos  para cada componente individual del gráfico
df_aux = pd.DataFrame({'V3':v3})
sns.displot(df_aux,kde = True,stat = 'density')
<seaborn.axisgrid.FacetGrid at 0x7fc721c59820>
sns.jointplot(x=v1,y=v2, alpha=0.4);
grid = sns.jointplot(x=v1,y=v2, alpha=0.4);
grid.ax_joint.set_aspect('equal')
sns.jointplot(x=v1,y=v2, kind='hex');
# establecer el estilo seaborn para todas las siguientes figuras
sns.set_style('white')

sns.jointplot(x=v1,y=v2, kind='kde', space=0);
iris = pd.read_csv('Data/iris.csv')
iris.head()
| SepalLength | SepalWidth | PetalLength | PetalWidth | Name | |
|---|---|---|---|---|---|
| 0 | 5.1 | 3.5 | 1.4 | 0.2 | Iris-setosa |
| 1 | 4.9 | 3.0 | 1.4 | 0.2 | Iris-setosa |
| 2 | 4.7 | 3.2 | 1.3 | 0.2 | Iris-setosa |
| 3 | 4.6 | 3.1 | 1.5 | 0.2 | Iris-setosa |
| 4 | 5.0 | 3.6 | 1.4 | 0.2 | Iris-setosa |
sns.pairplot(iris, hue='Name', diag_kind='kde', height=2);
plt.figure(figsize=(8,6))
plt.subplot(121)
kk = 4
sns.swarmplot(x='Name', y='PetalLength', data=iris,s = kk);
plt.subplot(122)
sns.violinplot(x='Name', y='PetalLength', data=iris,s = kk);
3.10. Tips#
3.10.1. Creando gráficos#
Figure
Operador |
Descripción |
|---|---|
fig = plt.figures() |
un contenedor que contiene todos los elementos del gráfico |
Axes
Operador |
Descripción |
|---|---|
fig.add_axes() |
Inicia un subplot |
a = fig.add_subplot(222) |
Un subplot es un AXES en un grid que tiene sistema fila-columna |
fig, b = plt.subplots(nrows=3, nclos=2) |
Agrega un subplot |
ax = plt.subplots(2, 2) |
Crea el subplot |
3.10.2. Graficando#
Datos 1D
Operador |
Descripción |
|---|---|
lines = plt.plot(x,y) |
Grafica datos conectados por líneas |
plt.scatter(x,y) |
Crea un gráfico de dispersión |
plt.bar(xvalue, data , width, color…) |
Gráfico de barras simple vertical |
plt.barh(yvalue, data, width, color…) |
Gráfico de barras simple horizontal |
plt.hist(x, y) |
Grafica un hisrograma |
plt.boxplot(x,y) |
Gráfico de caja y bigotes |
plt.violinplot(x, y) |
Gráfico de violín |
ax.fill(x, y, color=’lightblue’) |
Llena el área debajo de la curva |
ax.fill_between(x,y,color=’yellow’) |
Llena el área entre de la curva |
Datos 2D
Operador |
Descripción |
|---|---|
fig, ax = plt.subplots() |
|
im = ax.imshow(img, cmap, vmin…) |
Mapa de colores con arrays RGB |
Guardando gráficos
Operador |
Descripción |
|---|---|
plt.savefig(‘pic.png’) |
Se guarda el gráfico |
plt.savefig(‘transparentback.png’) |
Se guarda el gráfico con fondo transparente |
3.10.3. Personalización#
Color
Operador |
Descripción |
|---|---|
plt.plot(x, y, color=’lightblue’) |
|
plt.plot(x, y, alpha = 0.4) |
Se fija un color |
plt.colorbar(mappable, |
|
orientation=’horizontal’) |
mappable: la Image, Contourset etc a los que aplica la barra de colores |
Markers
Operador |
Descripción |
|---|---|
plt.plot(x, y, marker=’o’) |
Se agrega el tipo de punto |
plt.scatter(x, y, marker=’.’) |
Se agrega un ‘.’ en cada punto |
Líneas
Operador |
Descripción |
|---|---|
plt.plot(x, y, linewidth=2) |
Se fija el ancho de la línea |
plt.plot(x, y, ls=’solid’) |
Se fija el estilo de la línea |
plt.plot(x, y, ls=’–‘) |
Se fija el estilo de la línea |
|
Las lineas son |
plt.setp(lines,color=’red’,linewidth=2) |
Fija las propiedades de las lineas |
Texto
Operador |
Descripción |
|---|---|
plt.text(1, 1,’Example |
|
Text’,style=’italic’) |
Ubica el texto en las coordenadas 1/1 |
ax.annotate(‘some annotation’, xy=(10, 10)) |
Ubica el texto |
|
Expresiones matemáticas |
Límites
Operador |
Descripción |
|---|---|
plt.xlim(0, 7) |
Fija el eje-x para mostrar 0-7 |
other = array.copy() |
Crea una copia del array |
plt.ylim(-0.5, 9) |
Fija el eje-y para mostrar -0.5-9 |
ax.set(xlim=[0, 7], ylim=[-0.5, 9]) |
|
ax.set_xlim(0, 7) |
Fija los límites |
plt.margins(x=1.0, y=1.0) |
Fija los márgenes |
plt.axis(‘equal’) |
Fija el ratio del gráfico a 1 |
Leyendas/etiquetas
Operador |
Descripción |
|---|---|
plt.title(‘just a title’) |
Fija el título del gráfico |
plt.xlabel(‘x-axis’) |
Fija la etiqueta del eje x |
plt.ylabel(‘y-axis’) |
Fija la etiqueta del eje y |
ax.set(title=’axis’, ylabel=’Y-Axis’, xlabel=’X-Axis’) |
Fija el título y las etiquetas de los ejes |
ax.legend(loc=’best’) |
No traslapa los elementos del gráfico |
Ticks
Operador |
Descripción |
|---|---|
plt.xticks(x, labels, rotation=’vertical’) |
Fija los ticks |
ax.xaxis.set(ticks=range(1,5), ticklabels=[3,100,-12,”foo”]) |
Fija los ticks de x |
ax.tick_params(axis=’y’, direction=’inout’, length=10) |
Hace que los ticks sean más largos dentro y fuera |
